by Bob Uttl (Feb 14, 2024
On January 4, 2024, our (Uttl, Violo, & Gibson) paper — “Meta-analysis: On average, undergraduate students’ intelligence is merely average” — was accepted for publication in Frontiers in Psychology Cognitive Science by Dr. Snehlata Jaswal, the handling editor and also Assistant Specialty Chief Editor. The same day, Frontiers announced the acceptance and published the abstract of the accepted paper on their website. Unexpectedly, on February 6, 2024, we were informed by Catriola Leslie that our paper was rejected (Frontiers Rejection #1), and on February 9, 2024, we received another rejection letter mysteriously signed “Frontiers in Psychology” (Frontiers Rejection #2). The story of the rejection of an already accepted paper was written up previously, although many details remain unknown.
According to Frontiers, the decision to reject an already accepted paper was made by Dr. Eddy Davelaar, Specialty Chief Editor of Frontiers in Psychology Cognitive Science. In rejecting our already accepted paper, Dr. Davelaar overruled the acceptance decision of Dr. Snehlata Jaswal, Assistant Specialty Chief Editor. The decision was triggered by “several posts” on X that were “flagged” for Frontiers by unknown persons (out of over 2,000 posts that our published abstract generated). Thereafter, Dr. Dalevaar “highlighted” issues with our manuscript, rejected it, unpublished an already published abstract, and pretended things never happened. In so doing, Dr. Davelaaar also erased the work of Dr. Jaswal, his Assistant Specialty Chief Editor, who accepted the manuscript, reviewers, authors, and Frontiers staff who spent hundreds of hours diligently working to process our manuscript and to get it published.
Despite repeated requests, we were not provided with the “several posts” nor the identity of the posters. Frontiers continues to keep that information in secrecy. We were not even given any opportunity to respond to any concerns that those flagged posts may or may not have raised.
Frontiers Rejection #1 came signed by Catriola Leslie, a person not qualified to judge the quality of our work nor to evaluate any criticism of it. We responded immediately on February 9, 2024, and as part of our response, we briefly addressed issues “highlighted” by Dr. Davelaar. A few days later, Frontiers Rejection #2 came signed “Frontiers in Psychology.”
Here we address Dr. Davelaar’s surprising issues with the accepted article in greater details. Our article as accepted by Dr. Jaswal and subsequently rejected by Dr. Davelaar is available here. A reader can refer to the accepted article and cross-reference it with Dr. Davelaar’s criticism. A reader can also note our earlier brief response to Dr. Davelaar’s criticism in our response dated Feb 6, 2024.
In our opinion and as detailed below, Dr. Davelaar did not even read our article as his numerous criticisms of it have no basis in reality, are false, and misrepresent facts.
Title issue (According to Dr. Davelaar)
Dr. Davelaar’s criticism of the word “merely” and the title is unwarranted
Dr. Davelaar wrote:
The title is demeaning and uninformative. “merely” is a laden word, where the expectation was more. The title essentially says that the average is the average. This has no information. To have the title be informative, the first “average” in “on average” is to be read as “overall”. The sentiment that the title brings may be deliberate, but there is no need to use tabloid-style titles for click-bait.
-> rephrase title to reflect actual work
Dr. Davelaar, Feb 6 & 9, 2024
There is nothing in our title — Meta-analysis: On average, undergraduate students’ intelligence is merely average — that could be even considered objectionable by any reasonable person. Undoubtedly, others may have chosen different titles.
While Dr. Davelaar may believe that the word “merely” is strictly verboten, it is not. It is a rather ordinary English word with no “laden” meaning. It means “nothing more than” or “only” (see merriam-webster.com). The word “overall” does not mean “average, and would be inappropriate in this context (see merriam-webster.com/dictionary/overall)
The reviewers and Dr. Jaswal, the handling editor and Assistant Specialty Chief Editor, accepted the title as written, Frontiers published it to the world, and no one had any issues with it until Dr. Davelaar decided to intrude into Dr. Jaswal’s territory and overturn the work of the reviewers and Dr. Jaswal, his Assistant Specialty Chief Editor.
On Feb 9, 2024, I briefly responded to Dr. Davelaar’s issue:
>>> The title succinctly reflects the actual work. The “average” refers to the mean. The use of “overall” would be misleading as it does not mean “average.” The title is informative and no less than three reviewers raised no concerns about it. While someone else may have given it a different title, this is the title we decided on and which was approved by three reviewers.
Dr. Uttl
Abstract issue (According to Dr. Davelaar)
Dr. Davelaar’s criticism of the words “mere” and “merely” as “demeaning” is unwarranted
Dr. Davelaar wrote:
Again demeaning language is used. For example, under results it says “mere 102 IQ”. Under discussion, it says “merely average”. There is no need for this. Furthermore, the 6 points raised in this section without context can be too easily misinterpreted. It easily reads as “there is no point in going to university or to hire university graduates”. This seems out of the realm of a meta-analysis.
Dr. Davelaar
Words “mere” and “merely” have no “demeaning” meaning. Their use was previously approved by reviewers as well as Dr. Jaswal, Assistant Specialty Chief Editor. Frontiers published the abstract to the world, and no one had any issues with it until Dr. Davelaar decided to intrude into Dr. Jaswal’s territory and overturn everyone’s work.
The six points are wide-ranging implications of a decline in undergraduate students’ IQ; they are valid points. Dr. Davelaar has not been able to attack our data nor execution of our research (except with falsehoods — see below).
One of the implications is that many reasons for going to university previously or for hiring university graduates are no longer relevant. Dr. Davelaar may not like it but as we discussed in the discussion section that is indeed what is happening. Many employers, including the Government of Canada, concluded that a university degree is no longer required and can be replaced with an adequate score on a multiple-choice intelligence test.
Importantly, again, the abstract was approved by reviewers and Dr. Jaswal, and published to the whole world. Dr. Davelaar had no standing to butt in and cause our article’s rejection, removal, and unpublishing of our abstract.
On Feb 9, 2024, I briefly responded to Dr. Davelaar’s criticism:
>>> There is no demeaning language. The word “mere” means “being nothing more than” (see merriamwebster.com). There is nothing demanding [sic] about a word “mere”. If you would prefer word “only” instead of “mere” that would be an acceptable suggestion.
Dr. Uttl
Introduction issues (According to Dr. Davelaar)
Dr. Davelaar’s claim that lines 77-82 “laid out” “the tone”, that the “article is not a meta-analysis” is false, unwarranted
Dr. Davelaar wrote:
In lines 77-82, the tone of the article is laid out and it is far from neutral. These lines also indicate that this article is not a meta-analysis, but for the most part an opinion piece.
Dr. Davelaar
Dr. Davelaar’s claim has no basis in reality. The lines 77-82 state:
In this article, we first examine the origins of this belief of brilliant undergraduate students. Second, we critically review the existing evidence demonstrating that this belief is a myth – a fairy tale from a bygone era that only a few still living remember. Third, we report a new study that examined changes in undergraduate students IQs from 1940s to present. Fourth, we discuss wide-ranging implications of our findings as well as the disastrous consequences of believing in myths and fairy tales of very smart undergraduate students.
Uttl, Violo, & Gibson, lines 77-82
The paragraph is merely a description of what is to come, given the article’s substance. It guides a reader.
First, the article clearly states that it reports on the meta-analysis. Accordingly, read in the context, a reader knows that “Third, we report a new study that examined changes in undergraduate students IQs from 1940s to present.” refers to that new meta-analysis that we conducted. However, the replacement of “study” with “meta-regression” or “meta-analysis” would be trivial.
Second, the tone is appropriate. The belief in brilliant undergraduate students is indeed a myth from decades ago, repeated like in a game of telephone.
Third, the article is not an opinion piece. It reviews numerous facts, including Wechsler normative data set analyses, presents a new meta-analysis, and appropriately discusses the wide-ranging implications of the findings.
Dr. Davelaar’s claim that “These lines also indicate that this article is not a meta-analysis” is patently false, and his claim that the article is “for the most part an opinion piece” is also patently false.
On Feb 9, 2024, I addressed Dr. Dalevaar’s false claims:
Lines 77-82 have an appropriate tone. There is nothing at all that would indicate the article is an “opinion” piece and not “meta-analysis”. The three reviewers raised no concerns.
Dr. Uttl
Dr. Davelaar’s claim that lines 84-127 are “all-out attack on Gottfredson and Kaufman & Lichtenberger” is false, unwarranted
Dr. Davelaar wrote:
The section between lines 84 and 127 is an all out attack on Gottfredson and Kaufman & Lichtenberger. This could have been packaged more sensitively. Instead, the authors add fuel to the fire and imply that Gottfredson and Kaufman & Lichtenberger are unscientific, unethical, and committed malpractice for not taking into account the Flynn effect.
Dr. Davelaar
We wrote in lines 84-127:
The origins of the belief of brilliant undergraduate students
What is the origin of this belief of brilliant undergraduate students? Careful examination of data cited in support of this belief shows that the data is (a) obsolete, collected decades or nearly a century ago, (b) often not representative of general nor specific populations, (c) often collected under unknown conditions and circumstances, and (d) often so poorly described that the very basic characteristics of samples cannot be established. For example, Gottfredson (1997) cited data from the Wonderlic Personnel Test (WPT) (Wonderlic, 1992) – a 20 minute, 50 item long multiple choice test – to support her strong claims about the relationship between IQ and life chances, training style, career potential, as well as her claim that IQ of “college format” ranges from 112 to 120. Wonderlic (1992) itself states that the “mean score for college freshmen” is WAIS IQ 115 or WPT 24 and that “college graduate mean [WAIS] IQ [is] 120” or WPT 29 (see p. 26). However, within Wonderlic’s (1992) sample, college graduates’ IQ actually ranged from 80 to over 146 WAIS IQ points (see Wonderlic, 1992, p. 25, for a range of WPT scores and p. 20 for translation of WPT scores to WAIS Full Scale IQ (FSIQ). Most critically, Wonderlic’s (1992) “norms” (p. 25) and specific occupation norms (p. 27) are actually not norms at all; they are scores of some job applicants somewhere, assessed under unknown circumstances, and assessed by unknown assessors. Examinees were never sampled to match any population census data, were not tested under standardized conditions, and nearly nothing is known about the examinees themselves. In fact, Wonderlic (1992) indicates that the scores were reported back to Wonderlic Personnel Test Inc. by various companies that decided to use WPT to examine job applicants. For example, “Teacher” norms with a mean WPT of 26 or WAIS FSIQ of 113 were reported back by ten unknown companies and reflected scores of 500 applicants for some unspecified teaching jobs (see p. 27). No other information was provided about these teaching job applicants, including their age, education level, or primary teaching assignments (e.g., early childhood, elementary, secondary/high school, college).
Similarly, Kaufman and Lichtenberger’s (2005) first source, Matarazzo (1972), states that the WAIS IQ of college graduates is 115 (see Table 7.3 in Mararazzo, 1972) and informs that the data in the table “is based on our own clinical experience and should provide the interested reader with data for a good working rule of thumb [emphasis added]” (p. 178). Kaufman and Lichtenberger’s (2005) second source, Jensen (1980), states that the mean IQ of college graduates is 120 and the mean IQ of “freshmen in typical four-year college” is 115 and states that these estimates were “compiled by Cronbach (1960, p. 174)”. In turn, Cronbach (1960) cites several sources published between 1930 and 1958, including a review of previously published studies by Plant and Richardson (1958) who concluded that an average college students’ Wechsler-Bellevue Intelligence Scale (WBIS) (Wechsler, 1939) FSIQ is 120, and the average college freshmen WBIS FSIQ is 116 (p. 230). Kaufman and Lichtenberger’s (2005) third source, Reynold et al. (1987), gives the mean WAIS-R FSIQ of college graduates (i.e., individuals with 16 or more years of education, including those with MA and PhD degrees) as 115.17 based on 244 adults of all ages with at least that level of education in WAIS-R (Wechsler, 1981) normative sample (tested in 1980). Kaufman and Lichtemberger’s (2005) source for WAIS-III FSIQ of college graduates being 116.8, Heaton et al. (2001), could not be examined as it was not published. However, Longman et al. (2007) analysis of WAIS-III normative sample showed that college graduates, that is, those with 16 or more years of education, had the mean WAIS-III FSIQ of only 111.6 (p. 429). Finally, Lezak et al.’s (2012) only citation is Anastasi (1965), also an ancient text.
Uttl, Violo, Gibson — lines 84-127
Lines 84 to 127 are factual descriptions of the origin of the belief of brilliant undergraduate students. If Dr. Davelaar examined the sources of these statements himself he would understand that these lines are nothing more than descriptions of facts.
There is absolutely nothing in these lines that could be construed as “all-out attack” unless Dr. Davelaar believes that pointing out the facts is “all-out attack.” There is also nothing that would suggest or imply that “Gottfredson and Kaufman & Lichtenberger are …, unethical, and committed malpractice for not taking into account the Flynn effect.”
If Dr. Dalevaar followed the trail of those statements, Dr. Davelaar would have to agree with us that our descriptions are accurate.
Dr. Dalevaar’s grave accusations are patently false and inappropriate.
However, in lines 175-177, some 5o lines later, we state:
Furthermore, it has been argued that a failure to adjust obsolete test scores or norms for Flynn Effect is unscientific, unethical, and malpractice (Fletcher et al., 2010; Flynn, 2007; Gresham & Reschly, 2011; Reynolds et al., 2010)
Uttl, Violo, & Gibson
It appears Dr. Dalevaar mixed up in his mind what we said vs. what others, including Kaufman, said about “a failure to adjust obsolete test scores or norms for Flynn Effect.” For example, at line 186-189, we quote from Reynolds, Chastain, Kaufman, and McLean (1987), at line 186-189:
… the failure to apply the Flynn correction [in Atkins cases] as we have described it is tantamount to malpractice. No one’s life should depend on when an IQ test was normed.
Uttl, Viol, & Gibson — lines 188-189, quoting Reynold et al. (2010)
Clearly, others, including Kaurman, said, in peer-reviewed papers, that failure to apply the Flynn correction is “tantamount to malpractice”. We also said, much later, in lines 716-722, that we agree with Kaufman and others.
Dr. Davelaar gravely misrepresented facts.
On Feb 9, 2024, I briefly responded to Dr. Davelaar:
>>> The statement that “The section between lines 84 and 127 is an all-out attack on Gottfredson and Kaufman & LIchtenberger” is false. The section tracks down the origin of the belief in a factual way. The section does not “imply that Gottfredson and Kaufman & Lichtenberger are unscientific, unethical, and committed malpractice for
Dr. Uttl, Feb 9, 2024
not taking into account the Flynn effect”. However, to be clear, Kaufman himself stated in a published paper that “the failure to apply the Flynn correction [in Atkins cases] … is tantamount to malpractice…” (see Reynolds, Chastain, Kaufman, & McLean, 1987) and we quote him/them for it.
Meta-analysis issue (According to Dr. Davelaar)
Dr. Davelaar wrote:
The meta-analysis section seems to be completely separate from the introduction. The tone is radically different and it is complete within 2.5 pages (compared to 5.5 pages of inflammatory introduction).
Dr. Davelaar
As is common, and as Frontiers require, Methods and Results are set off from Introduction. However, the last section of Introduction explains the rationale and objectives for the meta-analysis.
There is nothing inflammatory in the introduction. Although, historically, people are sometimes inflamed by criticism and truth. For example, in the Middle Ages, people thought the Earth was flat and were very inflamed when someone pointed out that it was round. Sometimes they were so inflamed that they burned message-bearers at the stake.
On Feb 9, 2024, I briefly responded to Dr. Davelaar’s criticism:
The meta-analysis flows from the rationale in the introduction and there is nothing inflammatory in the introduction unless someone thinks that it is inflammatory to point out facts as to what Wechsler normative data say and to point out misinformation in scientific and popular literature.
Dr. Uttl, Feb 9, 2024
Discussion issues (According to Dr. Davelaar)
Dr. Davelaar’s criticism of the length and focus of our discussion is unwarranted
Dr. Davelaar wrote:
The discussion is far too long and not focused on the actual meta-analysis.
Dr. Davelaar
First, our paper was well within Frontiers’ stated limits. Second, Frontiers does not have any limits on the length of the discussion. Third, one reason for the lengthy discussion is that in response to the reviewers’ comments, we were adding more text. Fourth, the reviewers and Dr. Jaswal, Assistant Specialty Chief Editor, accepted our manuscript, including the discussion.
The discussion is focused on the wide-ranging implications of the key findings from our meta-analysis.
While Dr. Davelaar opinions may be different that is not the reason to overrule Dr. Jaswal, his Assistant Specialty Chief Editor, reject the manuscript after it was accepted, unpublish the published abstract, and waste everyone’s time.
Dr. Davelaar’s criticism that our “meta-analysis did not take this [Flynn Effect] into account” is patently false, misrepresentation, and unwarranted
Dr. Davelaar wrote:
…The discussion starts by stating that later Wechsler tests are harder than earlier tests. Yet, the meta-analysis did not take this into account. In and of itself, this influence the perceived decline in IQ over the years.”
Dr. Davelaar
The fact that “later Wechsler tests are harder than earlier tests” is due to so-called Flynn Effect and renorming of the tests. We explained in the introduction what Flynn Effect is and demonstrated that Wechsler tests are affected by Flynn Effect (see lines 129-156). Critically, Dr Dalevaar’s next statement — “Yet, the meta-analysis did not take this into account” – is astonishingly false.
First, Method, line 373-380, explains that we adjusted FSIQ for Flynn Effect:
To obtain FSIQ adjusted for the Flynn Effect, 0.3 IQ points/year were substracted from reported FSIQ for each year that elapsed between the standardization year and the year of testing examinees in each sample…
Uttl, Violo, & Gibson
Second, Results, line 397-402, informs a reader that Table 3 included FSIQ means as well as Flynn Effect adjusted FSIQ means:
Table 3 shows descriptive information for each of the 106 undergraduate student samples. The table includes the first author, …, FSIQ mean and standard deviation, … and Flynn Effect adjusted FSIQ.
Uttl, Violo, & Gibson
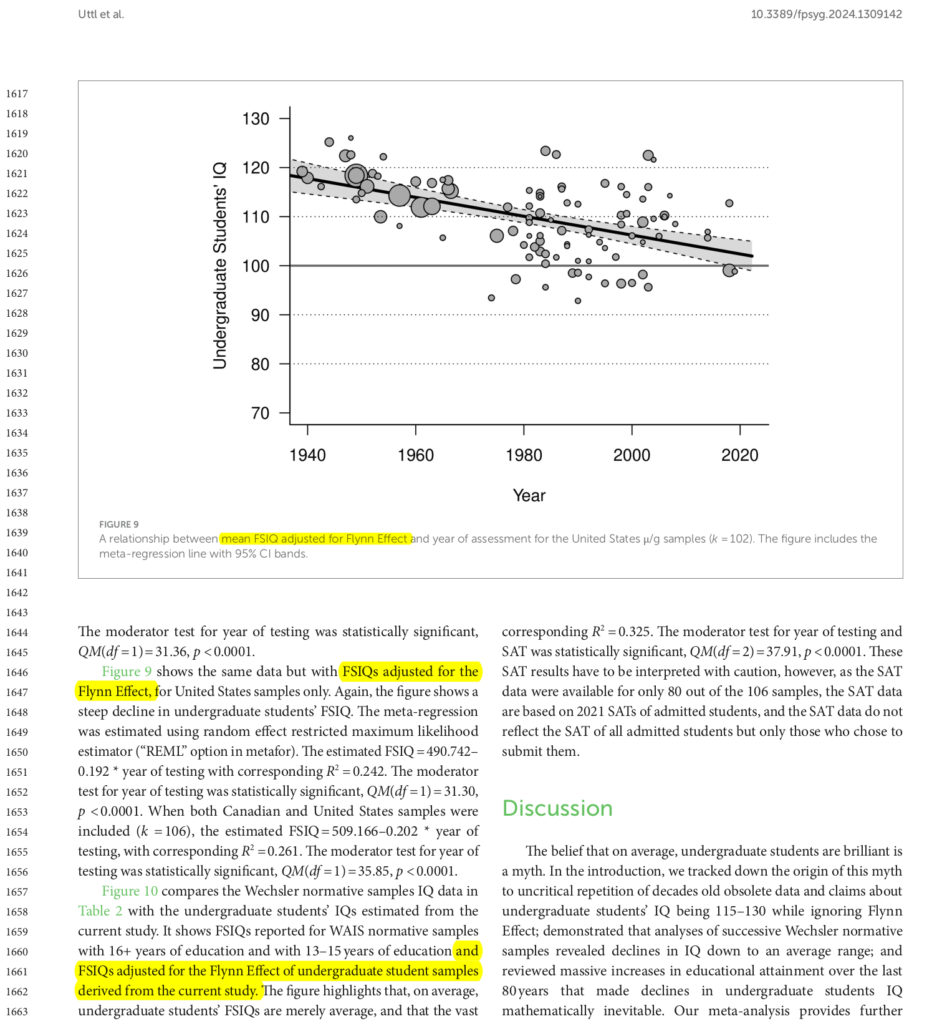
Third, Results, line 418-419, points a reader to meta-analysis of IQ scores adjusted for Flynn Effect:
Figure 9 shows the same data but with FSIQs adjusted for the Flynn Effect, for US samples only…
Uttl, Violo, & Gibson
Fourth, A caption of Figure 9 (lines 821-823) says that meta-analysis results in this figure are adjusted for Flynn Effect:
A relationship between mean FSIQ adjusted for Flynn Effect and year of assessment for the US u/g samples (k = 102). The figure includes the meta-regression line with 95% CI bands.
Uttl, Violo, & Gibson
An excerpt from Frontiers’ copy proof also makes it clear that our meta-analysis adjusted FSIQs for Flynn Effect (see yellow highlighted text):
We cannot think of a reasonable explanation for Dr. Dalevaar’s patently false unfounded criticism of our paper. If he read our paper, it would be crystal clear to him that we did take Flynn Effect into account. It is impossible to miss. If he did not read our paper, he demonstrated that he is either unwilling or unable to perform the duties of Specialty Chief Editor as detailed on the Frontiers website.
On Feb 9, 2024, I briefly addressed Dr. Davelaar criticism as follows:
>>> The statement that “the meta-analysis did not take this [Flynn Effect] into account.” is patently false. See the method, results, and figures that were corrected for Flynn Effect. Please read the paper before criticizing it.
Dr. Uttl, Feb 9, 2024
Methodological quality issues (According to Dr. Davelaar)
Dr. Davelaar’s criticism that our illustration at lines 198-202 “contains an error, which is very wrong”
Dr. Davelaar wrote:
Lines 198-202 contains an error, which is very wrong. It states “The basic laws of mathematics dictate that college students’ and college graduates’ IQs must have declined substantially over the last 80 years. For example, if 80% of the population pursues undergraduate education and if they have an average IQ of 115, the remaining 20% of the population would have to have an average IQ of 40 to maintain the average IQ of the entire population at 100.”
This reasoning comes from this: If 80% have an IQ of 115, 20% have an IQ of X, and the total IQ is 100, then X = (100 – 0.8 x 115) / 0.2. However, the maximum average IQ of 80% of a distribution with mean 100 and standard deviation 15 is around 105 IQ points. Hence, the example of IQ of 115 from 80% of the population is mathematically impossible. To get 115 IQ points the example would have to use 38.5% of the population. This is more than half the number used in the example, defeating the illustration of a detrimental impact of those with IQ less than 100 on the overall student IQ. In particular, the IQ of the remaining 61.5% of the population is around 90.6 IQ points to bring the overall IQ to 100.
The calculation used by the authors does not take the distribution into account, leading to false interpretations. This should be corrected.
Dr. Davelaar
Dr. Davelaar verified our example by making it into an equation and solving for X. Indeed, “X = (100 – 0.8 x 115) / 0.2” = 40, precisely as we stated. Thus, if 80% of the population had an average IQ of 115, the remaining 20% of the population would have to have an average IQ of 40. We assumed a reader would know, or read our introduction, examine Figures 2 and 3, and would understand that IQs below 70 are rare (about 2% rare), and, therefore, 20% of the population cannot have an average IQ of 40. Thus, the example shows that “The basic laws of mathematics dictate that college students’ and college graduates’ IQs must have declined… [down from 115]” In fact, Dr. Davelaar agreed with us and concluded: “Hence, the example of IQ of 115 from 80% of the population is mathematically impossible.” Exactly what we were saying!
Dr. Dalevaar’s statement that “Lines 198-202 contains an error, which is very wrong” is itself “an error, which is very wrong.”
Dr. Davelaar’s example is irrelevant and also impossible. Dr. Davelaar’s example merely says that if the normal distribution is divided into two parts at IQ of 104.4, the two parts would have 61.5% and 38.5% of the population, respectively, and that the average IQ of the two parts would be 90 and 115 respectively. This example is irrelevant because we gave an example for 80% of the population having IQ of 115 and being in the top part. If Dr. Dalevaar slid the cut point in the normal distribution down to IQ of 87.4, then the top part would include 80% of the population and the bottom part would include 20% of the population. Moreover, the average IQ of the bottom 20% would be 79 and the top 80% would have an average IQ of 105 – 10 IQ points lower than 115. If Dr. Dalevaar used 80% example, he would have arrived to the same conclusion: if 80% are college students and college graduates, their average IQ must have declined substantially and could not be 115.
We note here that Dr. Dalevaar’s example is, however, purely theoretical and impossible for several reasons: (a) individuals do not pursue undergraduate studies based on their IQs only, (b) universities do not admit individuals based on IQ only, (c) IQ tests are imprecise, and not perfectly reliable, (d) correlation among different IQ tests are also not perfect, and as the result, the correlation between IQ and becoming a college student is far from perfect. In turn, this further reduces the average IQ of college students (again, this is dictated by the basic laws of mathematics, in particular, by the imperfect correlation between IQ and admission to undergraduate studies).
One more time: Dr. Davelaar did not identify any error; Dr. Davelaar merely verified our calculations and our example.
On Feb 9, 2024, I briefly addressed Dr. Davelaar’s criticism as follows:
>>> Lines 198-202 have no error. They explain, in simple terms, that the average IQ cannot be 100 if 80% of the population pursues undergraduate education. It is mathematically correct as your equations nicely demonstrated. It is an example designed to demonstrate that “the basic laws of mathematics dictate that college students’ and college graduates’ IQs must have declined substantially” as the proportion of the population pursuing undergraduate education increases. Of course, it would also create a non-normal distribution as you point out. However, the point is that the undergraduate students’ IQ can’t be 115 if 80% of the population pursue undergraduate degrees. If you wrote a paper yourself, you could have used a different example.
Dr. Uttl, Feb 9, 2024
Dr. Davelaar’s claim that “no numbers are given” to support the claim that college students and graduates’ IQ dropped is an astonishing falsehood
Dr. Davelaar wrote:
In line 213, there is a suggestion of IQs having dropped “far below” where they once were, but no numbers are given.
Dr. Davelaar
Line 213 plus the surrounding text says:
WAIS normative sample data confirm that college students’ and collewge graduates’ IQs have dropped far below the levels they once were [115-130] and suggests that college students’ and graduates’ IQs today are not apprecciably different from the average IQ of the entire population.
Uttl, Violo, Gibson — lines 212-215
Contrary to Dr. Davelaar’s falsehoods, the numbers are given right above line 213. Dr. Davelaar needs to read lines 202-210:
In fact, the IQ of college students did decline substantially. Table 2 shows FSIQ by years of education for normative samples of WAIS-R (normed between 1976 and 1980 or in 1978 on average), WAIS-III (normed in 1996), and WAIS-IV (normed from March 2007 to April 2008 or, taking a midpoint, in 2007). Over 29 years, the FSIQ of college graduates (i.e., 16 or more years of education) dropped from 115.3 to 107.4, or 0.27 IQ points per year. Similarly, the IQ of examinees with some college education (1 to 3 years) who did not (yet) graduate dropped from 107.4 to 101.4. Finally, the IQ of examinees who attended at least some college (i.e., 13 years of education or more) dropped to FSIQ 104.5 by the 2008 standardization of WAIS-IV.
Uttl, Violo, Gibson — lines 202-210
Dr. Davelaar’s assertion is an astonishing falsehood. The numbers are given right above and in Table 2. I reiterate that it is necessary to read the paper first before criticizing it.
On Feb 9, 2024, I briefly addressed Dr. Davelaar’s criticism as follows:
Regarding line 213, the numbers are given just above inlines 202-210 — please look and read before making false claims that “no numbers are given.”
Dr. Uttl, Feb 9, 2024
Dr. Davelaar’s criticism of our claim that SAT data show undergraduate students’ mean IQ in many institutions is below 100
Dr. Davelaar wrote:
The authors tried pursued [sic] the reader that universities are admitting students with an IQ less than 100 (line 287). However, they use SAT scores instead of IQ scores. They go to great lengths to then justify this usage. They presume that the mean of the SAT total is the point of an IQ of 100. In fact Frey and Detterman (2004) used regression equations that include and intercept of 40 or 50 IQ points. This greatly decreases the authors’ claim that “a large proportion” of universities are admitting students with an IQ less than 100. Finally, in this section, the authors did not check the IQ distribution of students in the 1940s. Thus, there is no information presented on whether institutions at the time of 115 IQ points for undergraduates also admitted students with IQ less than 100
Dr. Davelaar
Dr. Davelaar missed lines 249-255 which explains that the College Board provided “SAT scores for Nationally Representative Sample”:
Notably, College Board also provided SAT scores for Nationally Representative Sample (College Board, 2021b). The Nationally Representative Sample, that is, the sample of all high school students rather than only those who typically take the SAT, averaged 507 on ERW and 506 on Math (the two means are indicated by dashed lines), and 1010 on SAT Total. Using the Nationally Representative Sample, the difference between, for example, Education vs. Mathematic and Statistics, using the IQ scale, is over 16 IQ points (Education SAT Total 101.6 vs. Mathematic and Statistics SAT Total 117.9).
Uttl, Violo, & Gibson — lines 249-250
We do not “presume” that the mean of the SAT total is the point of an IQ of 100″; we take the College Board’s word for it. The College Board says that it is a “Nationally Representative Sample.” SAT data converge with Wechsler normative IQ data reviewed in the introduction. Wechsler normative data show that the mean IQ of those with at least some college education (undergraduate students and college graduates) dropped to 104.5 by 2007 already.
Frey and Detterman (2004) used a regression equation which, most certainly was not developed on the “Nationally Representative Sample” because at the time the College Board did not publish any such data.
Regarding “the IQ distribution of students in the 1940s”, if their mean IQ was 115, it is pretty certain that only a small portion of students (16% or so) had IQs below 100, given the distribution of IQs having M = 100 and SD = 15 in the general population.
Dr. Davelaar’s criticism is unfounded. It is crystal clear that many institutions are admitting students with IQs below 100. It cannot be otherwise given that roughly 65% pursue undergraduate education.
On Feb 9, 2024, I briefly addressed Dr. Davelaar’s criticism as follows:
>>> We did not try to persuade anyone; we outlined the facts. Readers can persuade themselves or they can continue to believe in myths. We used IQ scores, including Wechsler normative samples, as well as SAT scores. We do not “presume that the mean of the SAT total is the point of an IQ of 100.” The College Board (2021b) provided those means and made clear that they represent “National Representative Sample” and we point the reader to it. Frey and Detterman (2004) did not have the data published 7 years later. Finally, IQs are standardized with SD of 15 so if the mean in 1940 was 115 IQ points it should be quite obvious that only about 16% of admitted students would score less than 100 in 1940.
Dr. Uttl, Feb 9, 2024
Scope Issues (According to Dr. Davelaar)
Dr. Davelaar’s criticism that our paper “has nothing to say about cognition” is false, unwarranted
Dr. Dalevaar wrote:
The rest of the discussion has nothing to do with cognition or intelligence …
Note that this paper has nothing to say about cognition. It does not talk about intelligence as a cognitive faculty, but instead presents an opinion on institutional student admission policies. For this reason, it is out of scope.
Dr. Davelaar
Dr. Dalevaar’s opinion is unfounded, false. First, “cognitive faculty” has the same meaning as “cognitive ability” (see merriam-webster.com for the meaning of “faculty” – https://www.merriam-webster.com/dictionary/faculty). Second, it is widely known that intelligence is part of cognition and that intelligence tests measure cognitive abilities. See for example APA Dictionary of Psychology for terms such as “intelligence” (https://dictionary.apa.org/intelligence), “cognition” (https://dictionary.apa.org/cognition), or IQ (https://dictionary.apa.org/iq). It may also be helpful to examine some introductory psychology or cognition texts, for example, Introductory Psychology (https://opentext.wsu.edu/psych105/chapter/chapter-7-cognition-intelligence/) explains:
Cognitive psychologists also study intelligence. What is intelligence, and how does it vary from person to person?…
Introductory Psychology, Cognition Chaper, OpenText
As to the discussion, all seven points explicitly discuss the implications of the decline in undergraduate students’ intelligence:
First, professors today are no longer teaching students with mostly above-average IQs as they did in the 1950. Instead, they are teaching students with mean IQs no different from 100, that is, the mean IQs of the general population. Furthermore, professors are also teaching students with a much wider range of abilities, specifically, IQs ranging from below 70 to above 130…
Second, employers can no longer expect employment applicants with undergraduate degrees to have appreciably higher IQs and mental abilities than the general population…
Third, students who are enrolled or who plan to enrol in higher education need to realize that acceptance into university is no longer an invitation into an elite group, that they will likely be in classes with students with huge variability in IQ ranges, and that only some portion of the education offered will be adapted to their level of ability…
Fourth, various claims in scientific, clinical, and popular literature about IQs of undergraduate students and university graduates being in the above average range (detailed above), for example, between “113 and 120” (Gottfredson, 1997, 1988, 2002, 2003), are plainly wrong…
Fifth, various methods of estimating premorbid IQs based on educational attainment are speculation and no longer evidence based as these estimates do not take into account (a) massive changes in educational attainment of populations, (b) large variability in mean IQs across institutions, (c) large variability of mean IQs across fields and subfields of study (as evidenced by SAT and GRE data detailed above), (d) large variability in IQs of individual students, and (e) Flynn effect…
Sixth, education adjusted norms such as Advanced Clinical Solutions (Wechsler, 2009) norms available for WAIS-IV and Wechsler Memory Scale IV (US) are similarly mere speculations and not evidence-based for the very same reasons; the demographic adjustment for education attainment does not take into account (a) massive variability in the mean IQ of students graduating from different universities, (b) large variability of mean IQs across different fields and subfields of study, (c) large variability in IQs of individual students, (d) the Flynn effect and the resulting norms obsolescence, and (e) rapid changes in educational attainment…
Finally [seventh], and critically, our research highlights what should be obvious to any informed person: obsolete IQ data ought not to be used, ever, to make high-stakes decisions about individuals, for example, by clinical psychologists, employers, vocational counsellors, or government agencies…
Uttl, Violo, & Gibson
Dr. Davelaar criticism is false, and unwarranted; it has no basis in reality. Our entire paper, including the discussion, is about intelligence, IQ, and cognition, in particular generational shifts in IQ of undergraduate students and their implications. It is definitely within the scope of Frontiers for Psychology Cognitive Science.
On Feb 9, 2024, I briefly addressed Dr. Davelaar criticism as follows:
>>> The comment “Note that this paper has nothing to say about cognition. It does not talk about intelligence as a cognitive faculty…” indicates that whoever made it is not even familiar with what cognition, intelligence, and “cognitive faculty” is. The individual does not understand that generational shifts in intelligence are saying something about shifts in cognition or “cognitive faculty”/cogntive ability across generations.
Dr. Bob Uttl, Feb 9, 2024
External commentaries related to “The basic laws of mathematics dictate that college students’ and college students graduates’ IQs must have declined substantially over the last 80 years…”
There are numerous commentaries on our published abstract that Frontiers/Dr. Davelaar since unpublished. Many point out that indeed massive increases in college enrollment must be accompanied by decreases in average IQ. This is one concept Frontiers/Dr. Davelaar finds difficult to understand. For example, Dr. Davelaar stated:
The first page of the discussion aims to give a neutral summary of the findings, but instead repeats the unfounded opinion that the widening participation policies of universities underlies to [sic] perceived decrease.
…
“Crucially, there is no evidence presented in this section that “massive increases in college enrolments” is causing the drop in IQ of students. Yet, it is heavily implied in the narrative”
Dr. Davelaar, Feb 6, 2024, & Feb 9, 2024
We did not think we had to lecture on the basic laws of mathematics. We may have been wrong. Here we point to some of the posts on the internet explaining the basic laws of mathematics in response to our published abstract (which Dr. Davelaar since unpublished). The very first one is by statistician, Dr. Willaim M. Briggs.
William M. Briggs (2024, Feb 8): The World’s Easiest Sociological Prediction Has Been Verified
Dr. Briggs starts:
We’ve discussed the Expansion Team Effect many times. I’m always embarrassed to do so because it’s so simple it’s a truism. What’s weird about it is that, presented one way, everybody gets it, agrees with it and says, “No kidding.” Yet presented a second way, a substantial number screech, “Reeeeeeeee!”
William M Briggs
Dr. Briggs’ first example goes as follows. You start a hockey league, get the best players in the world, and the quality of the play will be sky-high. As Dr. Briggs points out: “By definition.” Then “some bright ruler” orders everyone to play in the hockey league and the quality of the game “must crater. ” As Dr. Briggs points out: “The play will, again, by definition, equal the quality of play and athleticism of the entire population. Which, as all know, is low.”
Dr. Briggs then proceeds to his second example:
Yet, make one little change and many loose their mind.
Instead of hockey, swap in college degrees.
The same analysis follows. The average academic and intellectual performance must crater. The system bogs down. “Degrees” lose any important meaning.
William M Briggs
We agree with Dr. Briggs.